D3 Pie Chart for React Native

Here is a D3 pie chart React Native component written in TypeScript. This is quite a bare-bones implementation and will require some customization to suit your needs. However, this should help you get started on creating your own D3 pie chart component. This component is IOS and Android compatible. Scroll to the end for the complete file.
Install Dependencies 🫡
You will need to add the d3 and SVG packages to your project.
npm install d3 react-native-svg
or
yarn add d3 react-native-svg
For IOS:
cd ios && pod install
Component Time 💃
Next, let’s create a file for our component. I’ll call mine PieChart.tsx. Add the following imports:
//PieChart.tsx

import React, { useState } from 'react';
import { View, TouchableWithoutFeedback } from 'react-native';
import Svg, { G, Path, Text } from 'react-native-svg';
import * as d3 from 'd3';
Now we’ll create interfaces for our data (singular) and our component’s props. Customize this as needed.
interface DataItem {
  label: string;
  value: number;
}

interface PieChartProps {
  data: DataItem[];
  width: number;
  height: number;
  innerRadius?: number;
  outerRadius?: number;
  padAngle?: number;
}
You will want to update DataItem to match your data’s specificities.
Now that we have these interfaces defined, let’s look at the PieChartProps in more depth.
const PieChart: React.FC<PieChartProps> = ({
  data,
  width,
  height,
  innerRadius = 0,
  outerRadius = Math.min(width, height) / 2,
  padAngle = 0.00,
}) => {
  //... code will go here
};

export default PieChart;
The data, width, height, and outerRadius properties are fairly self-explanatory given their types and usage.
The innerRadius property can be used to create a donut shape — you can increase this value to add an inner circle to your pie chart. innerRadius=0 means that your chart is a pie chart and anything greater than 0 makes it a donut.
padAngle refers to the padding of each ‘slice’ of your pie. A padAngle of zero means that each slice will ‘touch’ its adjacent slices.
I recommend playing around with these properties.
Let’s now define some variables:
const pie = d3.pie<DataItem>().sort(null).value(d => d.value);
pie is a pie generator:
-
d3.pie<DataItem>()creates a new pie generator, which is used to transform the data you give it into the required pie chart format. It also calculates the chart’s slice angles. -
.sort(null)allows you to specify a sorting method. Passingnullwill keep the order in which the data is given. -
.value(d => d.value)specifies the pie generator’s value accessor function. Basically, determines how to extract the numerical value from each data item. In this example, our numeric value is stored asvalueinDataItem.
const arcGenerator = d3.arc().innerRadius(innerRadius).outerRadius(outerRadius);
arcGenerator is an arc generator (I know) and it is used to create SVG path definitions which are in turn used to render the chart’s slices according to the innerRadius and outerRadius values from above. SVG path definitions are directions that are used to actually ‘draw’ the chart.
We can now use pie and arcGenerator to generate our arcCentroid (the center point of the chart) and create our chart’s SVG path like so:
const arcs = pie(data);

const arcPath = (arc: d3.PieArcDatum<DataItem>) => {
  const path = arcGenerator({
    ...arc,
    innerRadius,
    outerRadius,
    padAngle,
  });
  return path ? path : undefined;
};

const arcCentroid = (arc: d3.PieArcDatum<DataItem>) => {
  const centroid = arcGenerator.centroid({
    ...arc,
    innerRadius,
    outerRadius,
  });
  return centroid;
};
The only thing left to do is to render our chart:
return (
  <View>
      <Svg width={width} height={height}>
          <G x={width / 2} y={height / 2}>
              {arcs.map((arc, index) => (
                  <React.Fragment>
                      <Path
                          d={arcPath(arc) || ''}
                          fill={d3.schemeCategory10[index]}
                      />
                      <Text
                          x={arcCentroid(arc)[0]}
                          y={arcCentroid(arc)[1]}
                          textAnchor="middle"
                          fontSize="12"
                          fill="white">
                          {data[index].label}
                      </Text>
                  </React.Fragment>
              ))}
          </G>
      </Svg>
  </View>
);
Here’s a brief explanation:
-
<Svg width={width) height={height}>is the root Svg component. It contains all the graphical elements of the chart and sets up the coordinate system. -
<G x={width/2} y={height/2}>this is used to group (hence ‘G’) the arcs and labels of the chart. It is positioned in the center of the Svg. -
Next, we simply loop over each arc in the
arcarray and render the corresponding path and label.
Note, <React.Fragment> wraps the <Path> and <Text> aka label inside <G> while allowing the map function to return multiple elements ( <Path> and <Text> ) for each arc.
Usage ✨
Here is an example of how you could use the component
import React from 'react';
import { View } from 'react-native';
import PieChart from './path/to/pie/chart';

function App(): React.JSX.Element {

  const reallyUsefulPieData = [
    { label: 'Cat A', value: 25 },
    { label: 'Cat B', value: 18 },
    { label: 'Cat C', value: 32 },
    { label: 'Cat D', value: 14 },
    { label: 'Cat E', value: 22 },
    { label: 'Cat F', value: 16 },
  ];

  return (
    <View>
      <PieChart height={300} width={300} data={reallyUsefulPieData} />
    </View>
  );
}

export default App;
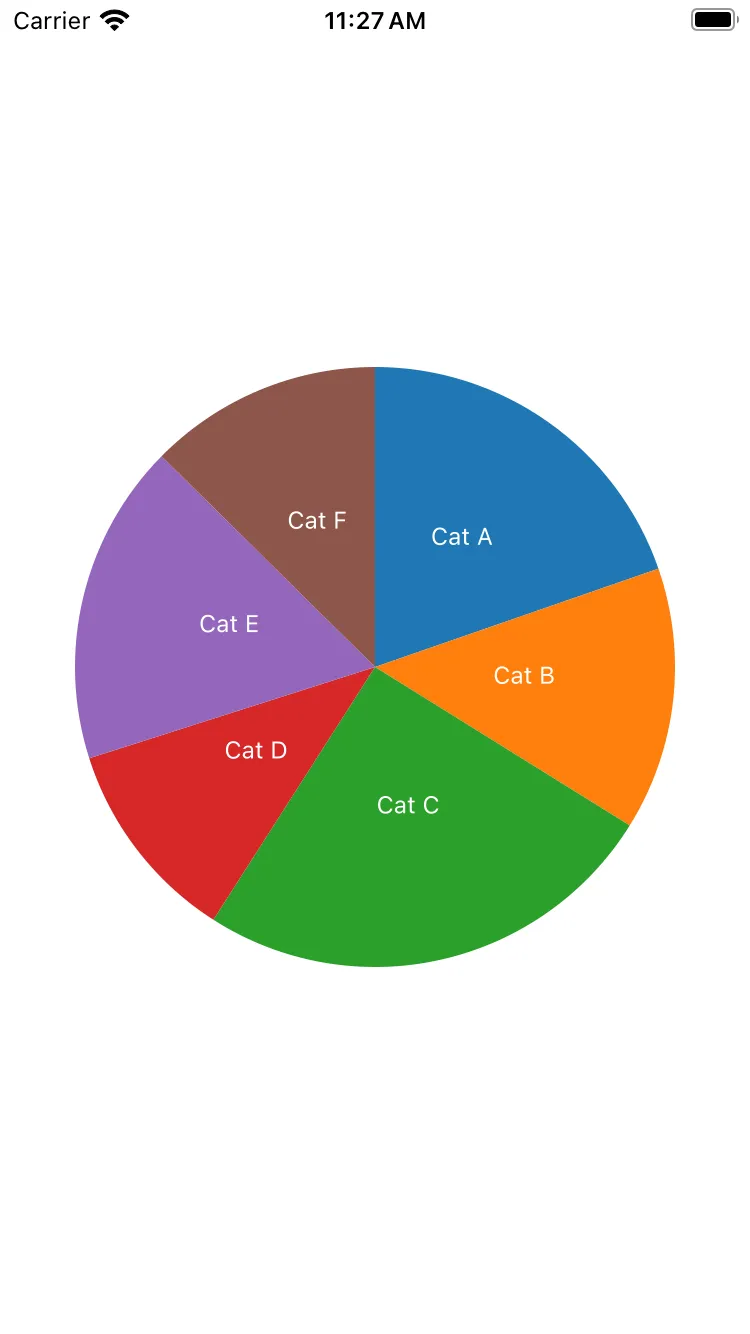
The Final Product 🥳
You’re probably curious about what this pie chart looks like. Here it is in IOS:
Here is the complete PieChart.tsx file:
import React, { useState } from 'react';
import { View, TouchableWithoutFeedback } from 'react-native';
import Svg, { G, Path, Text } from 'react-native-svg';
import * as d3 from 'd3';

interface DataItem {
    label: string;
    value: number;
}

interface PieChartProps {
    data: DataItem[];
    width: number;
    height: number;
    innerRadius?: number;
    outerRadius?: number;
    padAngle?: number;
}

const PieChart: React.FC<PieChartProps> = ({
    data,
    width,
    height,
    innerRadius = 0,
    outerRadius = Math.min(width, height) / 2,
    padAngle = 0.0,
}) => {
    const pie = d3
        .pie<DataItem>()
        .sort(null)
        .value(d => d.value);
    const arcGenerator = d3
        .arc()
        .innerRadius(innerRadius)
        .outerRadius(outerRadius);

    const arcs = pie(data);

    const arcPath = (arc: d3.PieArcDatum<DataItem>) => {
        const path = arcGenerator({
            ...arc,
            innerRadius,
            outerRadius,
            padAngle,
        });
        return path ? path : undefined;
    };

    const arcCentroid = (arc: d3.PieArcDatum<DataItem>) => {
        const centroid = arcGenerator.centroid({
            ...arc,
            innerRadius,
            outerRadius,
        });
        return centroid;
    };

    return (
        <View style={{ width, height }}>
            <Svg width={width} height={height}>
                <G x={width / 2} y={height / 2}>
                    {arcs.map((arc, index) => (
                        <React.Fragment>
                            <Path
                                d={arcPath(arc) || ''}
                                fill={d3.schemeCategory10[index]}
                            />
                            <Text
                                x={arcCentroid(arc)[0]}
                                y={arcCentroid(arc)[1]}
                                textAnchor="middle"
                                fontSize="12"
                                fill="white">
                                {data[index].label}
                            </Text>
                        </React.Fragment>
                    ))}
                </G>
            </Svg>
        </View>
    );
};

export default PieChart;
Thanks for making it this far! I hope you found this article useful!
